


In this context, limited access to comprehensive operational and contextual information on turbine operation has hampered the ability of wind farm owners to improve performance, plan maintenance and generate the most revenue from their assets.
To meet this challenge LR has continued to evolve our services to wind farm operators through the application of data analytics and machine learning. Utilising high frequency data from an operating windfarm, new software tools and specialist domain knowledge we have developed new capabilities and functionality that:
- Significantly speeds up the data cleansing process;
- Automates the monitoring and diagnostics of turbine operation and performance issues;
- Displays key relationships and combinations of data, bringing performance optimisation to life.
This means wind farm operators have real-time information at their fingertips to optimise decision making and improve performance, benefitting from increased revenue from the electricity generated and reduced operational costs due, for example, to on-site interventions.
Quickly identify risks and issues
Risk matrices for each potential type of turbine failure are viewable for an aggregated windfarm portfolio down to a single turbine for the frequency converter, pitch system, yaw system and gearbox. These are numbered, colour coded and ranked in terms of likelihood of occurrence and potential consequence based on past, current or future status of each component. This means clients can quickly pinpoint issues or areas for improvement and take action to mitigate, maximising monetisation of the asset and avoiding loss of power or disconnection from the grid.
Better measure performance against minimum availability objectives
Our solution uses automated methods for data cleaning and categorising power curve data, meaning it’s much simpler for operators to access the insight they need directly.
Production periods can be easily distinguished from periods where the turbines are unavailable. This highlights where to focus in diagnosing the causes of poor availability - which may be due to failures or delays in the execution of maintenance tasks.
Quickly identify under-production
By applying advanced statistical models, suboptimal performance issues such as pitch errors and yaw misalignments can be diagnosed and the effect on power production can be quantified. Also by benchmarking the best performing turbine and plotting the signal of one turbine against another, the behaviour of two turbines can be compared to quickly indicate which has been under-producing. Through automation, we have also improved the reliability and repeatability of this process so that patterns and common causes of inconsistent or degraded performance can be identified more easily.
Minimise gearbox degradation
Using 10 minute summary data from SCADA systems to capture gearbox behaviours is not enough to identify certain characteristics; for example, attempting to use lubricant temperature to monitor the health of a gearbox which includes an active cooling system. Typically, the frequency of the heating and cooling cycle is too high. Through analysis of 5 second data, we have been able to automatically isolate the heating phase and extract an index of the heat generated by the gearbox – thereby analysing not only the temperature of the oil, but also the rate of heating of the oil. Tracking this index over time reveals important information about the health of the gearbox and degradation over time. The same approach is also applicable to other systems which are actively cooled, such as hydraulic systems and power electronics.
By identifying a heating/time gradient we can identify inconsistencies, enabling improved maintenance strategies. If these become more frequent over time, it is likely that there has been permanent deterioration of the gearbox mechanical components such as gear teeth, bearing rollers or bearing races.
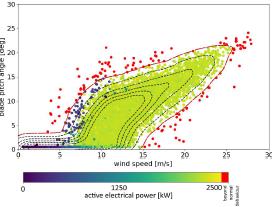
Rapidly detect pitch system anomalies
Our advanced methods of machine learning enable identification and visualisation of unhealthy turbine behaviour. For instance, a ‘fingerprint’ of healthy operation of the pitch system is used to rapidly detect any deviations, either visually or automatically, for further investigation. The example below illustrates one of the modern machine learning approaches we employ to classify the behaviour of the pitch system. The numerical contours shown, calculated automatically, indicate points in time at which the system was operating outside normal bounds. Further investigation would identify the causes and suggestions could be made about mitigation of the negative consequences.
Predict future operation through Machine learning
By deriving a relationship between various SCADA signals and the electrical power we are able to create a data driven digital twin, or statistical model, of an asset’s performance. Estimates of performance, via simulations of behaviour, running simultaneously with the physical turbine are compared with measured values. This means any deviation from expected behaviour is easily flagged, passed to diagnostic or prognostic software and also highlighted to technicians and managers in the wind farm operations centre.
Outcomes:
- A user-friendly platform that integrates all key performance parameters and diagnosis;
- An automated supporting infrastructure utilising machine learning and advanced statistical models;
- A potential 5-10% revenue gain by mitigating performance issues and reducing maintenance costs.