


A location-based approach is used to track progress against targets using each region's average grid emissions factor to calculate Scope 1 and 2 emissions. Reported emissions data is calculated in line with the GHG Protocol. This shows a 12% increase in emissions compared to last FY. Our increase in Scope 1 emissions was primarily due to a change in calculation methodology. For FY25, Lloyd’s Register has adopted an activity-based approach for our company owned vehicles. On a comparable basis, the increase reflects the methodological improvement rather than a significant change in underlying travel activity.


A location-based approach is used to track progress against targets using each region's average grid emissions factor to calculate Scope 1 and 2 emissions. Reported emissions data is calculated in line with the GHG Protocol.
This shows a 1% reduction in emissions compared to last FY.
Our reduction in Scope 2 emissions was due to a reduction in our building portfolio in the UK.


This shows a 12% increase in emissions compared to last FY for Purchased Goods & Services and +88.5% for Business Travel.
Our increased emissions for Purchased Goods & Services has been driven largely by continued improvement in the accuracy in our reporting through the application and use of more appropriate emission factors.
Business travel emissions have increased compared to the previous financial year, primarily due to a change in calculation methodology.


This is calculated as at 31/07/25.
Based on an intensity-based metric we disclosed emissions based on per FTE basis.

= 10 (LTIs) x 200,000 / 7,201,617 (hours worked) =
= 14 (TRIs) x 200,000 / 7,201,617 (hours worked) =

Safety Observation 2,827
We have incorporated Health and Safety data to promote transparency in health and safety practices.
This data helps the public assess risk, provides information for investigation, and enables better oversight of workplace practices, all of which contribute to a safer environment

We have included our employee average training hours to demonstrate our commitment to employee development and skill enhancement.

This covers both training attended online via our Learning management system and externally using verified providers. The training ranges from induction training through to role specific high-risk operations training e.g . Working at height and covers all levels of employees from admin to our CEO.

We publish our GPG data for the UK only as this information is not captured in all LR countries of operations due to legal requirements.
We have included this in our wider ESG disclosures to demonstrate our commitment to transparency and fair compensation practices.
*UK Only

As a global organisation we have included a count of the nationalities of our colleagues globally.

Countries in which LR has a physical office presence.

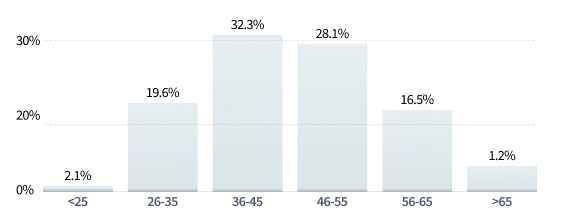
We have incorporated the percentage of employees in the defined age range.
This is to support our customers and colleagues better understand the age demographics of the LR business

We have included our employee turnover to provide stakeholders with insight into our company's human capital management and its potential impact on performance.

We have included our employee engagement.
(last survey 2025)

We have incorporated the percentage of employees determined by male / female.
This is to support our customers and colleagues better understand the demo graphics of the LR business.

We have included our NPS to demonstrate our commitment to customer loyalty and satisfaction and continuous improvement of our service delivery for our clients.
An NPS score of over 30 is considered Great. The Global average is 32.

We have included the percentage of revenues we derive from low carbon services to demonstrate our support for the energy transition and decarbonisation of the ocean economy.


This metric reflects the number of unique passages/routes that we optimized to drive impactful results towards bunker fuel efficiency, reduced cost, positive commercial, environmental and time gains for our customers.

LR certification for assets associated with offshore wind power generation and other offshore renewable power generation.


This is the cost equivalent in USD and represents the monetary savings that we generated through delivering optimized vessel route services to our clients whereby reducing bunker fuel consumption and saving fuel to that value.

This metric is the overall bunker fuel conserved through route optimization services that are both cost effective and environmentally sustainable.
underway (Environment)
